Delivery performance
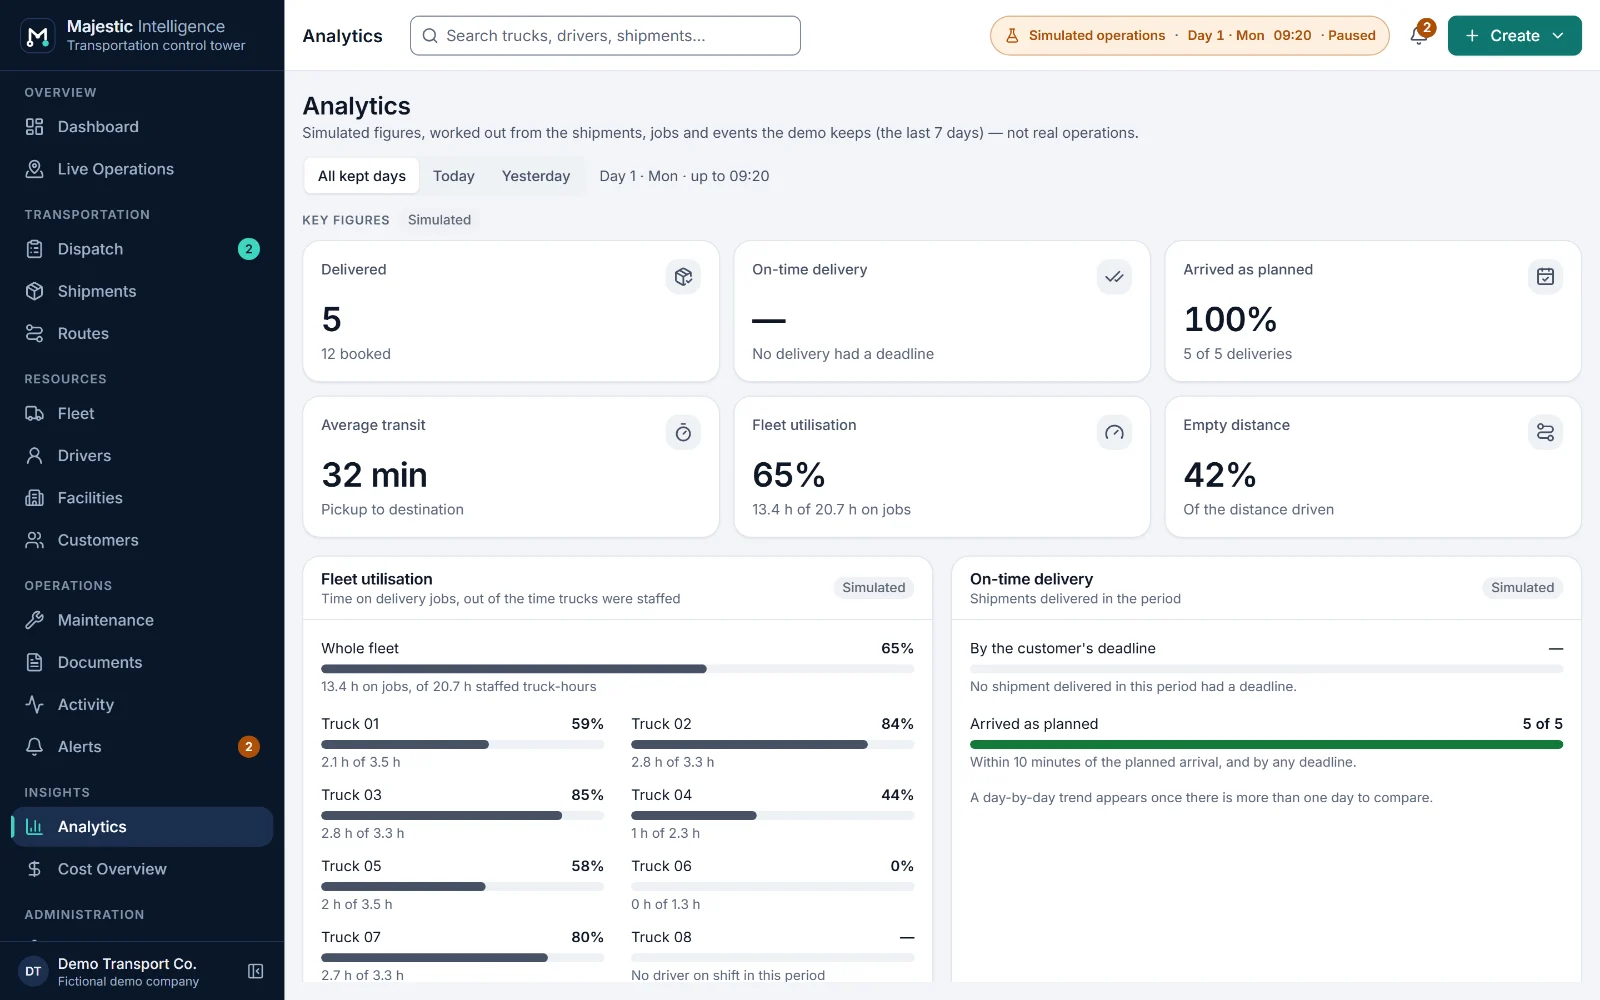
On-time delivery against customers' deadlines, deliveries that arrived as planned, and average transit from pickup to destination.
Measure
Analytics turns the jobs the fleet has done into the figures an owner asks about, over today, yesterday or all the days kept. The Cost Overview estimates revenue, cost and contribution from rates you set, and labels every figure as illustrative.
The problem
Performance figures that arrive at month end describe a month nobody can change any more, and a single bottom-line number hides whether the trouble is empty running, waiting at docks or late deliveries.
The value
Each figure is computed from the operation and defined in plain words, so it can be checked against the jobs behind it. Lanes that run late, trucks that wait and kilometres driven empty become visible while the pattern is still forming.
What it does
Each of these is on a screen of the working demo. Open it to try it on the simulated operation.
On-time delivery against customers' deadlines, deliveries that arrived as planned, and average transit from pickup to destination.
Truck-hours on delivery jobs against truck-hours in service with a driver on shift; empty distance as a share of all kilometres driven.
Deliveries, average transit and the late share for each lane: each pickup-to-destination pair, whichever roads the trucks took.
How long trucks spend at pickup facilities, from arrival to departure.
Revenue estimate, cost estimate (fuel, driver pay for the hours on the job, maintenance) and contribution before overheads for each delivered shipment, with totals by customer, by lane and by day, from example rates you set.
A plain-language log of operational events, kept for 3, 7 or 14 days, with an export of the history.
Benefits
More features
A dashboard of what needs a decision, and every truck and facility on a satellite map or a 3D view of the operation.
A dispatch board by stage, suggested trucks with the reasons in words, and planned dispatch by rules you can read.
Every shipment with its timeline, priority and deadline, and its bill of lading and proof of delivery tracked to the end.
See it working
Open the working product: trucks loading, on the road and unloading across California’s Inland Empire. No sign-up; nothing connects to real systems.
Built by METHODSS
METHODSS adapts Majestic Intelligence to your fleet, sites and rules and connects it to your data, or designs and builds new logistics software with you.